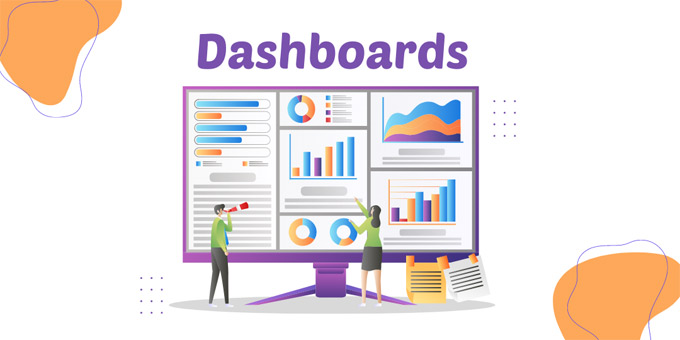
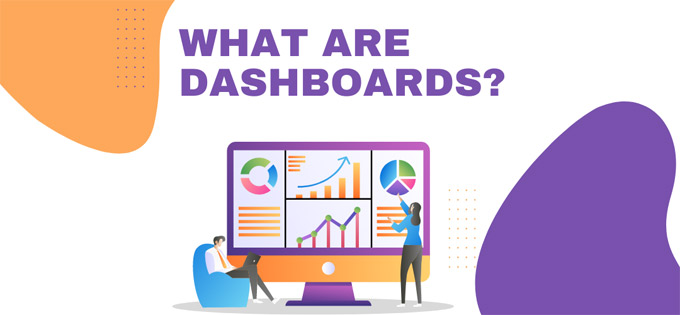
A dashboard is a tool for business intelligence and information management. Data dashboards are like a dashboard of a car. They organize, store, and display important information from multiple sources in one place. A dashboard is a type of graphical user interface that often provides a glance view of key performance indicators relevant to a particular objective or business process.
A dashboard is usually placed on its own page. It receives information from a linked table. It is often configurable so you can choose the data you want and include graphs or charts to visualize them.

Data is everywhere and has changed the way we live, including in businesses. Organizations across all sectors can use digital data to enhance their processes, innovations, and initiatives using the power of insights. It can be difficult to know which data to use with the abundance of stats, facts, and figures available in today's hyperconnected world.
There are many processes that can impact the performance of businesses. If you look "under the hood", there are hundreds. It can be hard to manage and extract value from the abundance of data available. Dashboards are a tool that simplifies data distribution and analysis. This allows businesses to revitalize their engines, making smarter, faster, more data-driven decisions.

Data dashboards are a tool that allows you to monitor, measure, analyze, and extract business insights from key datasets. They also display information in an interactive, intuitive, and visual manner.
These provide a complete overview of the company's internal departments, goals, and initiatives, as well as processes and projects. These key performance indicators (KPIs) provide insight that can be used to encourage growth and improvement.

Dashboards improve data accessibility and transparency throughout the business. They are useful for both regular business users as well as advanced data analysts. They allow you to monitor operational health and gain high-level insights into performance.
Dashboards can be used by all levels of the company - marketing teams use them for tracking conversion rates and campaigns, sales teams use them for tracking opportunities, and founders and executives use them for a comprehensive view of company performance and growth.


